
Google BigQuery recently introduced a new feature: the “Overview” section. Think of this function as a central hub that simplifies navigation and overall control within this complex data analytics environment.
BigQuery has long evolved beyond being a mere database or a storage solution for fast processing of big data. Today, it is a much more robust and comprehensive tool covering nearly the entire analytical lifecycle—from data ingestion to visualization.
The Power of AI in BigQuery
Google has been investing heavily in AI-related infrastructure and services, which is clearly reflected in BigQuery’s features. Within this environment, you can now leverage various AI agents, such as the Data Insight Agent, Data Science Agent, and Data Engineering Agent. With their help, it is essentially possible to build an entire data warehouse, including data pipelines (ETL). While practice shows that complex tasks still require user patience and further investment from Google, the direction in which data analytics and business intelligence are heading is already clear.
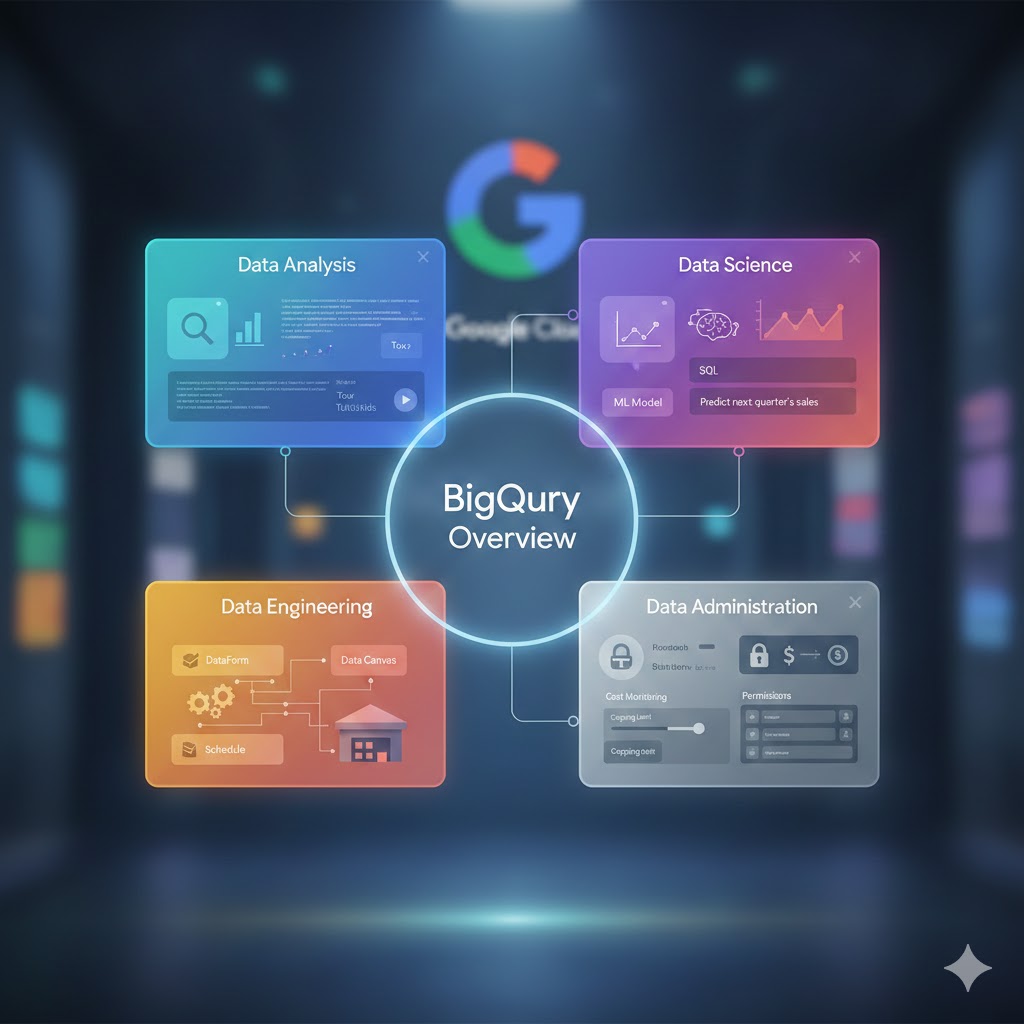
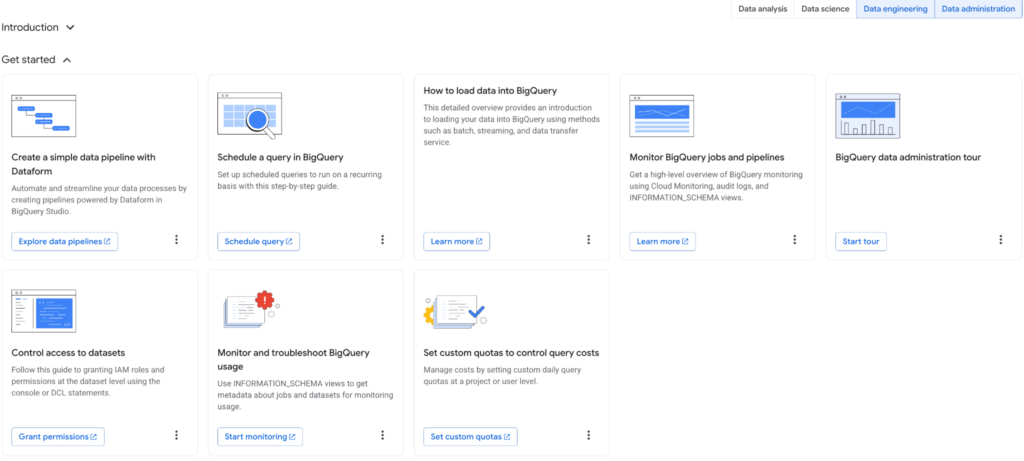
In the “Overview” section, you can view BigQuery through four distinct lenses:
- Data Analysis
- Data Science
- Data Engineering
- Data Administration
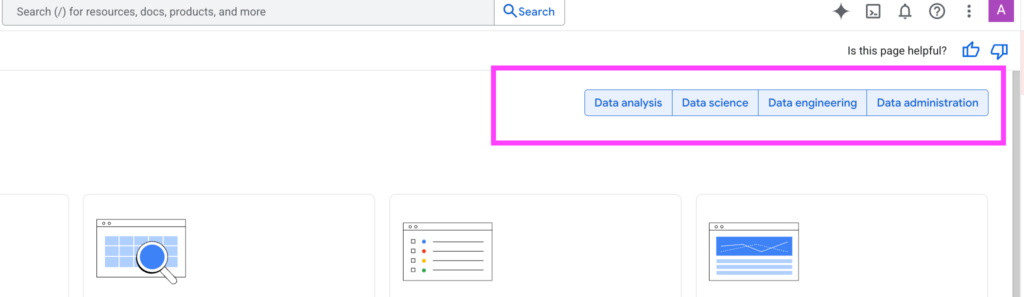
These sections can be filtered (toggled on or off) to customize the displayed content. This isn’t just a feature list; it serves as a smart navigation tool across extensive documentation, making it significantly easier to find specific topics.
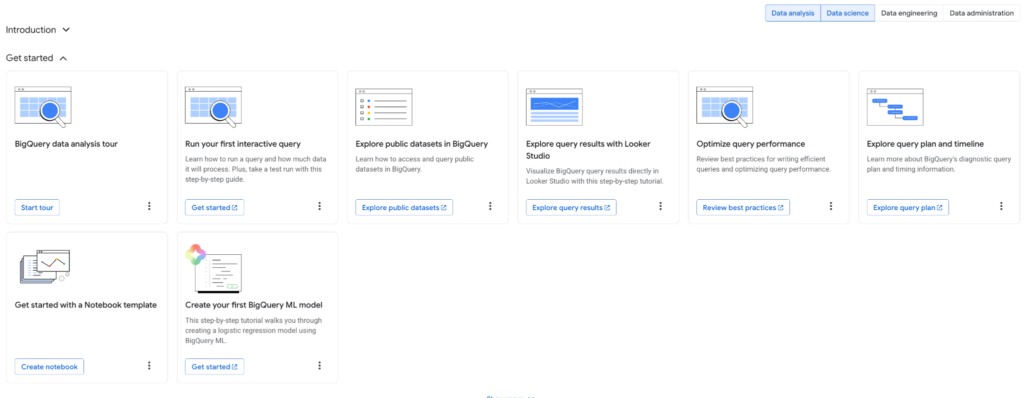
Data Analysis and Data Science
Beginners will appreciate the “tour” feature—a series of tutorials integrated directly into the platform. These guides focus on practical tasks: how to upload your first data, create a visualization, or work with public datasets. This feature greatly accelerates the onboarding process.
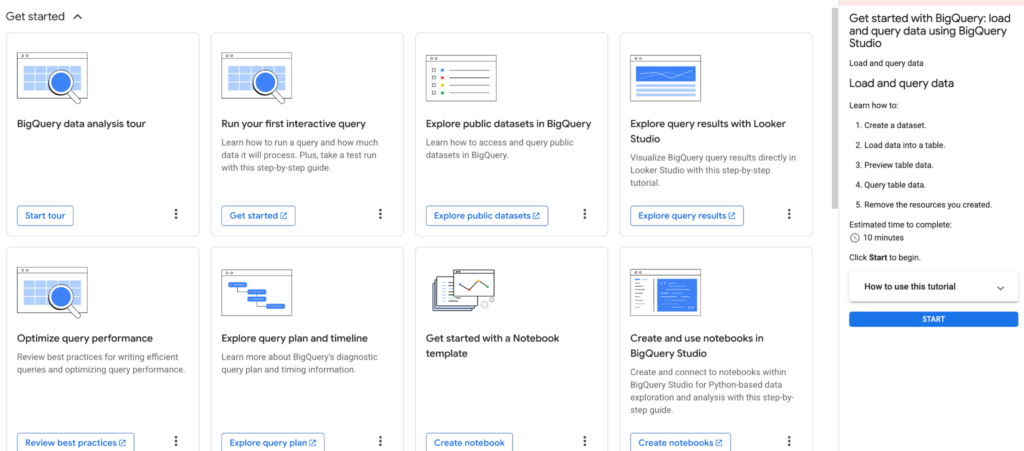
BigQuery offers numerous ways to process data. You can simply upload files from Google Sheets or formats like CSV and run queries immediately. For more advanced workflows, BigQuery Notebooks are available.
Democratizing Technology through AI
Thanks to the tight integration with Vertex AI, you can create and call ML models directly within the BQ environment (and even using SQL). Deep knowledge of MLOps isn’t required; basic SQL and a look at the documentation are enough. This approach democratizes advanced technology, making it accessible to a wider audience. Furthermore, a significant portion of the code today can be generated by the language model itself.
For example, generating SQL queries using natural language is now a reality. Prompts should be factual and concise, without unnecessary complexity (I will cover this topic in more detail in an article planned for January 2026). The built-in model suggests a specific query that you can insert into the editor or further adjust using the “refine” function. You can also use the “query summary” feature for verification.
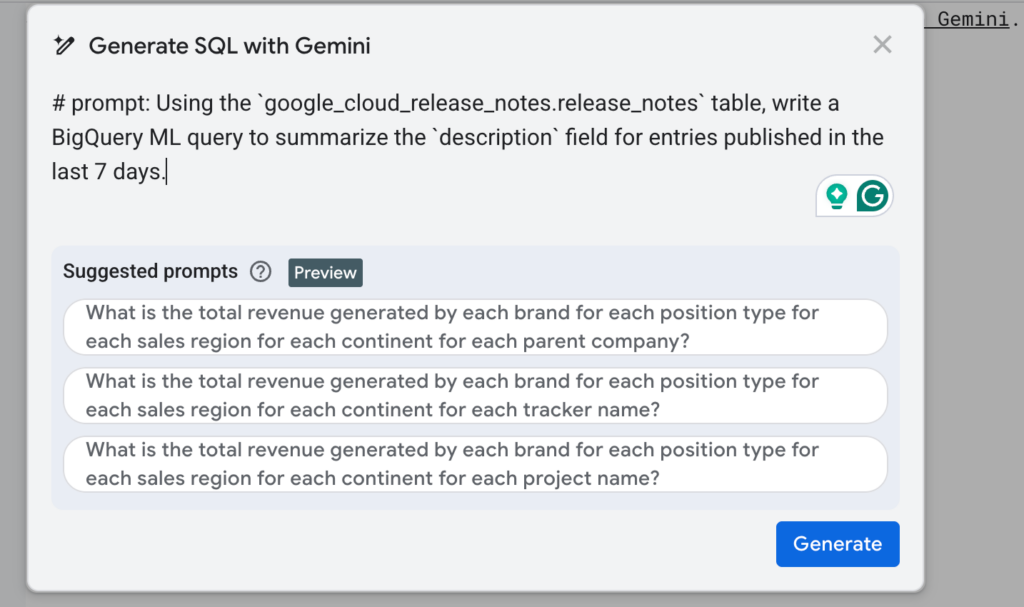
The trend is clear: analysts and data scientists will no longer have to write all code “from scratch.” This is a true game-changer that opens the world of AI and ML to business users, gradually blurring the lines between technical and non-technical roles.
-- # prompt: Using the `google_cloud_release_notes.release_notes` table, write a BigQuery ML query to summarize the `description` field for entries published in the last 7 days.
SELECT
 ml_generate_text_result.ml_generate_text_result AS summary
FROM
 ML.GENERATE_TEXT( MODEL `cloud-ai-platform.generative_models.gemini-pro`,
   (
   SELECT
     description
   FROM
     `bigquery-public-data.google_cloud_release_notes.release_notes`
   WHERE
     as_of_daily >= DATE_SUB(CURRENT_DATE(), INTERVAL 7 DAY) ),
   STRUCT( 0.2 AS temperature,
     100 AS max_output_tokens ) )
For Advanced Users
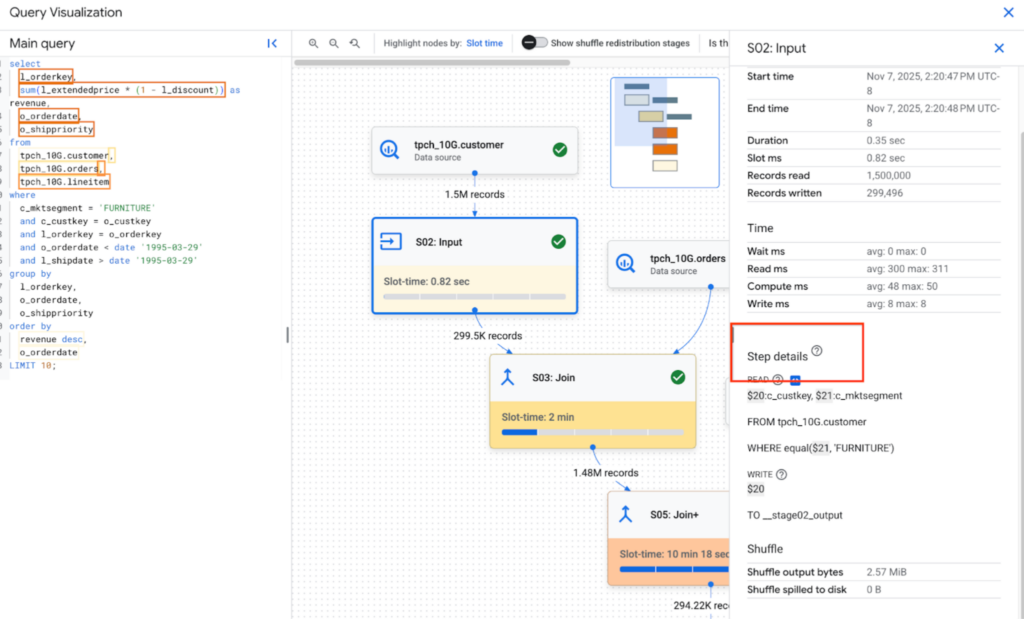
Experienced users can monitor query progress and resource consumption in detail, which is crucial for optimizing pipelines and costs (FinOps). BQ offers various pricing models, and the documentation provides detailed best practices for query optimization. Since BQ is a column-oriented database, mastering partitioning and clustering is essential to minimize the volume of data scanned.
Data Engineering and Administration
This section focuses on the technical side: from data storage and transformation to scheduling and monitoring costs or troubleshooting pipeline errors.
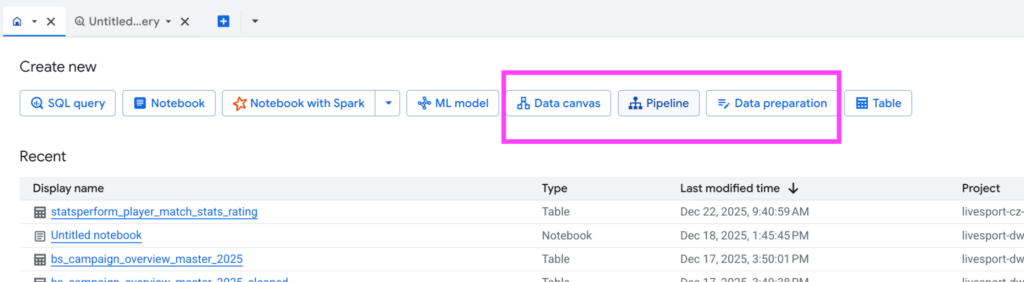
A key tool here is DataForm—an orchestration feature for managing data pipelines directly within BQ. Google acquired it in 2020, and after full integration, it now serves as a core service. Pipelines are written in SQL with a JavaScript configuration layer. Additionally, BQ Studio offers low-code/no-code tools like Data Canvas and Data Pipelines.
While AI agents assist with simpler tasks, it is still safer to rely on custom scripts for complex architectures (even if AI helps generate them). Full control over ETL processes cannot yet be entirely handed over to agents.
FinOps and Permissions Management
In the realm of cost monitoring, user education is fundamental. It is vital to know that using SELECT * is inefficient in BQ and that the database prefers a denormalized structure (unlike traditional relational databases using 3NF to 5NF). BQ also allows for capping—setting limits (credits) on queries or specific time periods.
Permissions management allows for granular access control, from functional levels down to individual datasets and tables. This is a complex discipline where errors can be costly, so a cautious approach is necessary (though AI models can also be consulted for best practices here).
Finally, the Analytics Hub deserves a mention. it enables secure data sharing within and outside the organization, opening the door to potential data monetization.

Leave a Reply